Key financial data
The table below provides an overview of some of the Swiss Re Group’s key financial data.
| Download |
USD millions unless otherwise stated |
2014 |
2015 |
||||
|
||||||
Total assets |
204 461 |
196 135 |
||||
Total investments |
143 987 |
137 810 |
||||
Total liabilities |
168 420 |
162 529 |
||||
Total debt1 |
14 316 |
12 812 |
||||
Common shareholders’ equity |
35 930 |
33 517 |
||||
Retained earnings |
34 257 |
37 526 |
||||
|
|
|
||||
Total revenues |
37 347 |
35 714 |
||||
Premiums earned and fee income |
31 262 |
30 214 |
||||
Net investment income – non-participating |
4 103 |
3 436 |
||||
Net investment result – unit-linked and with-profit |
1 381 |
814 |
||||
Total expenses |
33 120 |
30 395 |
||||
Claims and claim adjustment expenses |
10 577 |
9 848 |
||||
Life and health benefits |
10 611 |
9 080 |
||||
Income tax expense |
658 |
651 |
||||
Current taxes |
1 072 |
582 |
||||
Deferred taxes |
–414 |
69 |
||||
Net income2 |
3 500 |
4 597 |
||||
|
|
|
||||
Earnings per share in CHF (basic) |
9.33 |
12.93 |
||||
Dividends paid to shareholders |
3 129 |
2 608 |
||||
Return on equity in % |
10.5 |
13.7 |
||||
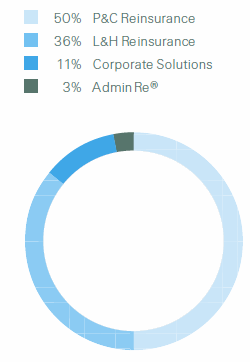
Net premiums earned and fee income by Business Unit
(Total USD 30.2 billion)
