Re/insurance
Annual expected losses (AEL)
AEL for weather-related natural perils can be used as an indicator for our average current climate-related risk exposure, while it does not capture the potential losses in years with intense natural catastrophe activity like 2017. (In the Insurane risk section you can see our risk exposures to four major natural catastrophe scenarios, ie single event losses with a 200-year return period.) The figures are the compound result of the expected weather activities, the vulnerability of insured objects, their values and the volume and structure of our insurance products. Changes in the AEL figures will show the evolution of our climate risk exposure. This could be due to climate change, but also due to changes in the vulnerability of insured objects, their values or changes in our business strategy. AEL figures are updated on an annual basis.
As per end of 2017, the four weather-related perils with the highest gross annual expected loss for our whole business were:
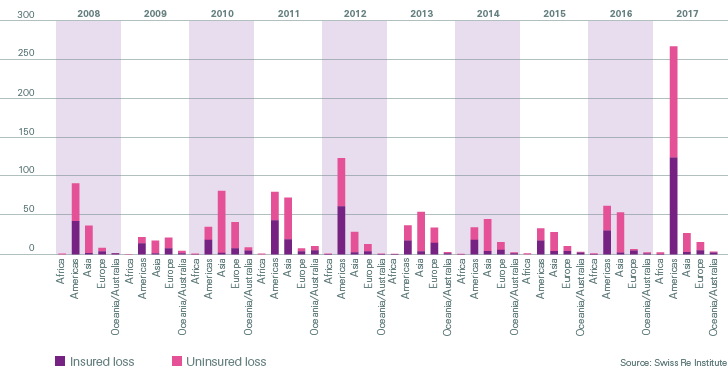
Weather-related catastrophes: insured vs uninsured losses
There is a substantial “protection gap” between total economic losses from weather-related catastrophes and insured losses in all regions. These data do not represent a company-specific metric but are an important overall risk indicator (see graph below).
Climate protection offered to (sub-)sovereigns
Cover against natural catastrophes accounts for approximately 14% of premiums in our P&C Reinsurance business. As we regularly update our risk models to reflect any changes in the underlying parameters and renew contracts annually, we are in position to offer our clients effective re/insurance protection against current climate-related risks.
Reflecting our efforts to help expand re/insurance protection by working with public-sector clients, we made this commitment to the United Nations: to advise up to 50 sovereigns and sub-sovereigns on climate risk resilience and to offer them USD 10 billion against this risk by 2020. You can see the progress we have made against this goal in the second table below.
Aligning our carbon intensity
We have recently started to develop a carbon business steering mechanism. This will help us to steer the overall carbon footprint embedded in our re/insurance business and align it to the Paris Climate Agreement and related Nationally Determined Contributions (NDCs), set with a view to limiting global warming to 1.5–2°C above pre-industrial levels.
Weather-related perils: Annual expected losses, swiss re group
| Download |
As of 31 December 2017 |
In USD millions |
North Atlantic hurricane |
480 |
US tornado |
220 |
European windstorm |
180 |
Japanese tropical cyclone |
130 |
Insured vs uninsured weather-related catastrophe losses, per region
in USD bn, at 2017 prices

Climate protection offered to (sub-)sovereigns
| Download |
|
2015 |
2016 |
2017 |
Number of (sub-)sovereigns advised |
13 |
26 |
66 |
Amount of climate protection offered (in USD) |
2.1 billion |
3.9 billion |
5.3 billion |
Scope 1, 2 and 3 greenhouse gas emissions
Reducing our carbon footprint is one of the four pillars of our climate strategy. As part of the Greenhouse Gas Programme, we have publicly reported on our Scope 1 and 2 greenhouse gas emissions plus a major source of Scope 3 emissions (business travel) since its launch in 2003. From 2013, we have expanded our reporting to include further Scope 3 emissions (see table below).
You can find out more about the Greenhouse Neutral Programme in our 2017 Corporate Responsibility Report.
CO2 emissions per employee (full-time equivalent, FTE), Swiss Re Group
| Download |
|
|
2013 kg/FTE |
2016 kg/FTE |
2017 kg/FTE |
Change in % since 2016 |
Change in % since 2013 |
||||
|
||||||||||
Scope 1 |
Heating |
378 |
305 |
264 |
–13.4 |
–30.2 |
||||
Scope 2 |
Power1 |
824 |
877 |
651 |
–25.8 |
–21.0 |
||||
Scope 3 |
Business travel |
3 713 |
4 109 |
4 126 |
0.4 |
11.1 |
||||
|
Copy paper |
40 |
24 |
17 |
–29.2 |
–57.5 |
||||
|
Waste |
50 |
41 |
34 |
–17.0 |
–32.0 |
||||
|
Water |
12 |
12 |
12 |
0 |
0 |
||||
|
Technical gases |
27 |
21 |
21 |
0 |
–22.2 |
||||
|
Commuting2 |
1 250 |
1 150 |
1 050 |
–8.7 |
–16.0 |
||||
Total |
|
6 294 |
6 539 |
6 175 |
–5.6 |
–1.9 |
||||