Investments
We measure and monitor the level of integration of our climate-related investment activities.
Green bonds
Green bonds, whose proceeds are used to finance environmentally sustainable projects facilitating the transition towards a low carbon economy. In the near term, we have committed to build a portfolio of at least USD 1.5 billion and are well advanced in the investment process.
Carbon footprint of our investment portfolio
In line with TCFD guidelines, we monitor the carbon footprint of our corporate credit and listed equity portfolio on a regular basis. We also evaluated the size of our private equity investments in coal related activities. For the carbon footprint, we use the metric “weighted average carbon intensity”, which defines the portfolio carbon intensity based on relative investment share.
Weighted average carbon intensity comparison of the US credit portfolio versus corresponding benchmark per end of 2017

The US credit portfolio is closely aligned with the corresponding benchmark in terms of weighted average carbon intensity.
Weighted average carbon intensity comparison of the UK credit portfolio versus corresponding benchmarks per end of 2017

The weighted average carbon intensity of the UK credit portfolio is comparable to the US portfolio, but is below its corresponding ESG benchmark at the end of 2017.
At the index level, the UK benchmark experiences higher carbon intensity compared to the US benchmark given the larger weight to the typically carbon intense utility sector in the UK index. The reduction of companies with high exposure to coal helped to drive the portfolio’s carbon intensity well below its benchmark.
Weighted average carbon intensity comparison of the listed equity portfolio versus corresponding benchmark per end of 2017

Listed equities in Swiss Re’s portfolio are much less carbon intense compared to their corresponding benchmark due to the active reduction of coal-related companies that exceeded the threshold of 30% and the single name selection of less carbon intense names across industries.
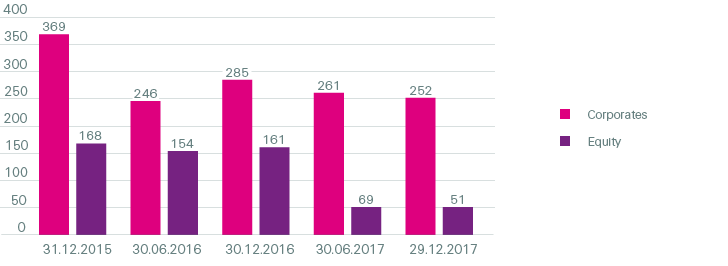
Weighted average carbon intensity comparison of credit and listed equities portfolios since measurement inception

Since the end of 2015, carbon intensities in both the credit and the listed equity portfolio decreased substantially as part of our thermal coal divestment of more than USD 1.3 billion. On the credit side, carbon intensity has been reduced as we stopped investing in thermal coal-related companies. On the listed equity side, the effect of avoiding coal was larger and led to a reduction of the intensity to one third of the amount at the end of 2015.