Group results
Our Group delivered a good net income of USD 3.6 billion.

“Swiss Re continues to create value for our clients and shareholders by applying our strategic framework.”
Christian Mumenthaler
Group Chief Executive Officer
Swiss Re reported a good net income of USD 3.6 billion for 2016, compared to USD 4.6 billion for 2015. The Group’s return on equity for 2016 was 10.6%, down from 13.7% for 2015. Common shareholders’ equity increased to USD 34.5 billion as of 31 December 2016, up by 6.5% compared to the end of 2015.
Reinsurance delivered net income of USD 2.9 billion, compared to USD 4.0 billion in 2015.
Property & Casualty Reinsurance contributed USD 2.1 billion in 2016, down from USD 3.0 billion in 2015. The current year’s performance demonstrated the benefit of continued solid underwriting against the backdrop of higher large losses and a lower contribution from positive prior-year development. The net operating margin was 15.4%, compared to 22.5% in 2015.
Life & Health Reinsurance accounted for net income of USD 807 million in 2016, down from USD 968 million in 2015, when the result benefited from more favourable valuation adjustments. Current year results were impacted by lower performance in the UK portfolio. The net operating margin decreased to 10.4% in 2016 from 12.2% in the previous year.
Corporate Solutions delivered net income of USD 135 million in 2016, compared to USD 357 million in 2015. The 2016 result was impacted by continued pricing pressure and large man-made losses. The net operating margin for Corporate Solutions was 4.2% and 14.1% for 2016 and 2015, respectively.
Life Capital, which includes ReAssure (formerly Admin Re®) and, as of 6 January 2016, the operations formerly known as Guardian Financial Services (Guardian), reported net income of USD 638 million in 2016, compared to USD 424 million in 2015. The increase was driven by investment performance, mainly from the Guardian portfolio, and solid business performance. Life Capital’s net operating margin increased to 27.0% in 2016, compared to 17.8% for 2015.
The Group’s net operating margin for 2016 was 13.0%, down from 17.1% for 2015.
Common shareholders’ equity, excluding non-controlling interests and the impact of contingent capital instruments, increased to USD 34.5 billion at the end of 2016, up from USD 32.4 billion at the end of 2015. The rise was driven by net income and an increase in unrealised gains on fixed income securities, partially offset by payments to shareholders for the 2015 regular dividend of USD 1.6 billion and the public share buy-back programmes of USD 1.1 billion.
Swiss Re achieved a return on equity of 10.6% for 2016, compared to 13.7% for 2015. Earnings per share for 2016 were CHF 10.55 or USD 10.72, compared to CHF 12.93 (USD 13.44) for the previous year.
Book value per common share increased to USD 105.93 or CHF 107.64 at the end of 2016, compared to USD 95.98 or CHF 96.04 at the end of 2015. Book value per common share is based on common shareholders’ equity and excludes non-controlling interests and the impact of contingent capital instruments.
Business performance
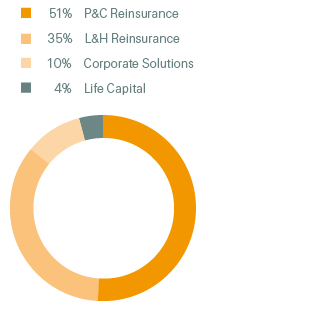
Net premiums and fees earned by business segment, 2016
(Total: USD 33.2 billion)

Premiums earned and fee income for the Group totalled USD 33.2 billion in 2016, an increase of 10.0% from USD 30.2 billion in 2015. At constant exchange rates, premiums and fees rose by 12.1%, reflecting growth in selected markets and lines of business, often through large and tailored transactions.
Premiums earned by Property & Casualty Reinsurance amounted to USD 17.0 billion in 2016, an increase of 12.7% from USD 15.1 billion in 2015. The rise was driven by large and tailored transactions in the US and in Europe. The Property & Casualty Reinsurance combined ratio was 93.5% in 2016, up from 85.7% in 2015. The increase was mainly driven by a higher large loss burden, continued price softening and a lower contribution from positive prior-year development compared to 2015. The prior year also benefited from particularly benign natural catastrophe experience.
Life & Health Reinsurance premiums earned and fee income totalled USD 11.5 billion in 2016, an increase of 8.6% from USD 10.6 billion year-on-year, driven by transactions in the US and successful renewals and new business wins in Asia. At constant exchange rates, premiums earned and fees increased by 11.3%.
Corporate Solutions premiums earned were USD 3.5 billion for 2016, an increase of 3.7% compared to the previous year, driven by the acquisition of IHC Risk Solutions. The Corporate Solutions combined ratio was 101.1% in 2016, up from 93.2% in the previous year, primarily impacted by large man-made losses.
Gross cash generation for Life Capital amounted to USD 721 million in 2016, up from USD 543 million in 2015 despite the unfavourable impact of decreasing interest rates in the UK across the year.
Investment result and expenses
The return on investments for 2016 was strong at 3.4%, compared to 3.5% in 2015, with the decrease reflecting slightly lower investment-related net realised gains on an increased asset base, in addition to the impact of lower reinvestment yields.
The Group’s non-participating net investment income increased to USD 3.7 billion in 2016, compared to USD 3.4 billion in 2015, largely driven by net asset inflows. The Group reported non-participating net realised investment gains of USD 1.5 billion in 2016, compared to USD 1.2 billion in 2015, reflecting a positive impact from interest rate derivatives.
Acquisition costs for the Group amounted to USD 6.9 billion in 2016, up from USD 6.4 billion in 2015. The increase mainly reflected large transactions in Reinsurance and a higher share of proportional business in Property & Casualty Reinsurance.
Operating expenses of USD 3.4 billion in 2016 increased by 3.4%, or 6.5% at constant exchange rates, reflecting a slightly lower expense ratio on a higher premium base compared to 2015.
Interest expenses were USD 606 million, a small reduction compared to 2015.
The Group reported a tax charge of USD 749 million on a pre-tax income of USD 4.4 billion for 2016, compared to a tax charge of USD 651 million on a pre-tax income of USD 5.3 billion for the same period in 2015. This translated into an effective tax rate in the current and prior-year reporting periods of 17.1% and 12.2%, respectively. The tax rate in 2016 was largely driven by benefits from the effective settlement of tax audits in certain jurisdictions and releases of valuation allowances on net operating losses, partially offset by tax on profits earned in higher tax jurisdictions. The lower tax rate in 2015 was largely driven by a tax benefit arising from a local statutory accounting adjustment for restructuring of subsidiaries and higher tax benefits from foreign currency translation differences between statutory and US GAAP accounts.