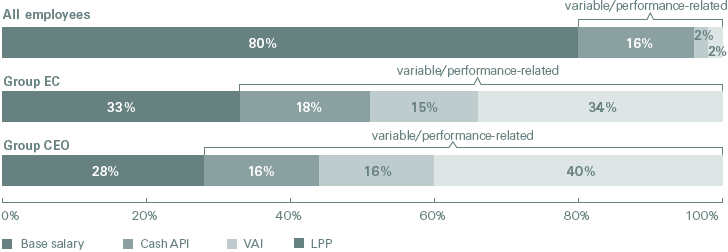
Compensation highlights in 2017
Pay for performance
The Compensation Committee ensures that Group EC compensation is linked to the business performance of Swiss Re by delivering a substantial portion of compensation in the form of variable and performance-related incentives.
| Download |
|
Base salary |
Variable/ |
of which deferred |
All employees |
80% |
20% |
23% |
Group EC |
33% |
67% |
73% |
Group CEO |
28% |
72% |
78% |

The Compensation Committee monitors how compensation is aligned with specific business metrics, including US GAAP net income and EVM profit.
| Download |
USDm (unless otherwise stated) |
2015 |
2016 |
change |
2017 |
change |
||||||
|
|||||||||||
US GAAP net income |
4 597 |
3 558 |
–23% |
331 |
–91% |
||||||
EVM profit |
480 |
1 399 |
191% |
–9 |
— |
||||||
Regular dividend payments (CHF)1 |
4.60 |
4.85 |
5% |
5.00 |
3% |
||||||
Financial Strength Rating (Standard & Poor’s) |
AA– |
AA– |
|
AA– |
|
||||||
Total equity |
33 606 |
35 716 |
6% |
34 294 |
–4% |
||||||
Regular staff worldwide |
12 767 |
14 053 |
|
14 485 |
|
||||||
Aggregate compensation for all employees (CHF millions)2 |
2 213 |
2 265 |
2% |
2 165 |
–4% |
||||||
Group EC members3 |
12 |
14 |
|
14 |
|
||||||
Aggregate Group EC compensation (CHF thousands)2, 3 |
47 360 |
51 430 |
9% |
43 159 |
–16% |
||||||
Attribution of Group income to key stakeholders
| Download |
USDm (unless otherwise stated) |
2015 |
% |
2016 |
% |
2017 |
% |
||||
|
||||||||||
Income before tax and variable compensation |
5 758 |
100% |
4 773 |
100% |
814 |
100% |
||||
Variable Compensation |
510 |
9% |
466 |
10% |
351 |
43% |
||||
Income tax expense |
651 |
11% |
749 |
16% |
132 |
16% |
||||
US GAAP net income attributable to shareholders |
4 597 |
|
3 558 |
|
331 |
|
||||
of which paid out as dividend1 |
1 561 |
27% |
1 559 |
33% |
1 650 |
203% |
||||
of which share buy-back |
1 018 |
18% |
1 006 |
21% |
1 0162 |
125% |
||||
of which added to retained earnings within shareholders’ equity |
2 018 |
35% |
993 |
20% |
–2 335 |
|
||||