Key financial data
The table below provides an overview of some of the Swiss Re Group’s key financial data:
| Download |
USD millions unless otherwise stated |
2013 |
2014 |
||||||
|
||||||||
Total assets |
213 520 |
204 461 |
||||||
Total investments |
150 075 |
143 987 |
||||||
Total liabilities |
180 543 |
168 420 |
||||||
Total debt1 |
18 540 |
14 316 |
||||||
Shareholders’ equity |
32 952 |
35 930 |
||||||
Retained earnings |
30 766 |
34 257 |
||||||
|
|
|
||||||
Total revenues |
36 902 |
37 347 |
||||||
Premiums earned and fee income |
28 818 |
31 262 |
||||||
Net investment income – non-participating2 |
3 947 |
4 103 |
||||||
Net investment result – unit-linked and with-profit |
3 347 |
1 381 |
||||||
Total expenses |
32 077 |
33 120 |
||||||
Claims and claim adjustment expenses |
9 655 |
10 577 |
||||||
Life and health benefits |
9 581 |
10 611 |
||||||
Income tax expense |
312 |
658 |
||||||
Current taxes |
641 |
1 072 |
||||||
Deferred taxes |
−329 |
−414 |
||||||
Net income3 |
4 444 |
3 500 |
||||||
|
|
|
||||||
Earnings per share in CHF (basic) |
12.04 |
9.33 |
||||||
Dividends paid to shareholders |
2 760 |
3 129 |
||||||
Return on equity in % |
13.7 |
10.5 |
||||||
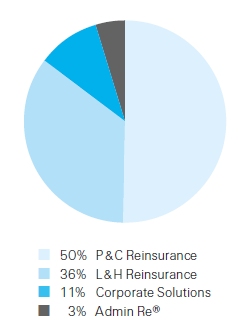
Net earned premiums and fee income by Business Unit
(Total: USD 31.3 billion)
