Investments
We measure and monitor the level of integration of our climate-related investment activities.
Green bonds
Green bonds, whose proceeds are used to finance environmentally sustainable projects facilitating the transition towards a low-carbon economy. In the near term, we have committed to building a portfolio of at least USD 1.5 billion, which we reached by 2018.
Physical risk assessment of real estate
In addition to considering physical risk when acquiring new properties, the physical risks of properties in the Real Estate investment portfolio have been analysed both for an “as is” climate scenario and for a future climate change scenario. This analysis was carried out leveraging in-house know-how and catastrophe loss models developed for the Reinsurance side. Results suggest a very low estimated financial impact from all perils, in particular climate-related perils.
Tar sands exposures
Tar sands assets are particularly carbon-intensive and susceptible to stranded asset risk given the long life of these assets, as well as the evolving regulations on carbon emissions. For that reason we decided to limit investments to issuers with less than 20% revenues from tar sands business in 2018.
Carbon footprint of our investment portfolio
In line with TCFD guidelines, we monitor the carbon footprint of our corporate credit and listed equity portfolio on an ongoing basis as we have extended our internal tools to allow for interactive day-to-day analysis. We also evaluated the size of our private equity investments in coal-related activities. For the carbon footprint, we use the metric “Weighted average carbon intensity”, which defines the portfolio carbon intensity based on relative investment share.
Weighted average carbon intensity comparison of the US credit portfolio versus corresponding benchmark per end of 2018

The US credit portfolio was closely aligned with the corresponding benchmark in terms of weighted average carbon intensity.
The weighted average carbon intensity of the UK credit portfolio was lower than that of the US portfolio, but above its corresponding ESG benchmark at the end of 2018.
Weighted average carbon intensity comparison of the UK credit portfolio versus corresponding benchmark per end of 2018

Since the previous year, the UK portfolio carbon intensity decreased by 20 units, while the corresponding index reduced by more than 130 units. The reduction in the index carbon intensity was mainly caused by a constituent update towards more sustainable issuers in the utility sector.
Weighted average carbon intensity comparison of the listed equity portfolio versus corresponding benchmark per end of 2018

Listed equities in Swiss Re’s portfolio continued to be much less carbon-intensive compared to their corresponding benchmark due to the active reduction of companies that exceeded the threshold of 30% in coal-related revenues and the single name selection of less carbon-intensive names across industries. In 2018, investments in emerging market equities partly offset prior reductions.
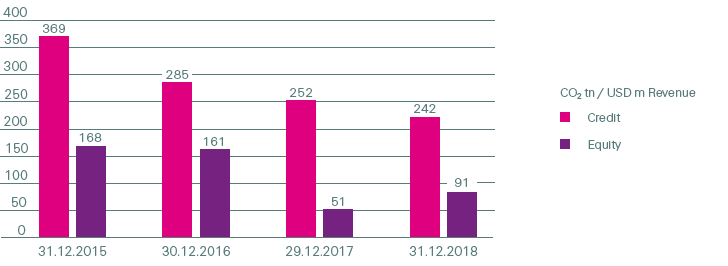
Weighted average carbon intensity comparison of credit and listed equities portfolios since measurement inception

Since the end of 2015, carbon intensities in both the credit and the listed equity portfolio decreased substantially as part of our thermal coal divestment of more than USD 1.3 billion. In the second half of 2018, investments in emerging market equities led to a modest increase in the weighted average carbon intensity of our listed equity portfolio.
Forward-looking carbon indicators
Companies may mitigate exposure to climate risk through adaptation to market forces or adherence to new and evolving requirements. We therefore undertook efforts to get a better understanding of the details behind carbon intensities and to further improve our monitoring based on that. For that reason we started to review the listed equities and corporate credit portfolios using forward-looking indicators related to carbon emissions. The analysis focused on the more carbon-intense sectors, responsible for the vast majority of the portfolio carbon intensity.
The forward-looking indicators allow to analyse particularly climate risk exposed industries down to issuer level and add an important piece to the carbon intensity analysis.
The results are encouraging in the sense that most issuers held in carbon-intense sectors have set a carbon reduction target and work actively towards lowering energy consumption, while improving operational efficiencies. This newly developed toolset will allow us to continuously improve our understanding of the carbon emissions we invest in and with that support our monitoring of involved stranded asset risks.