Business Units at a glance
Working across diversified insurance risks and businesses to maximise shareholder value.
Reinsurance
Reinsurance provides clients and brokers with reinsurance products, insurance-based capital market instruments and risk management services. Reinsurance operates globally through two segments – Property & Casualty and Life & Health.
Net premiums earned and fee income (USD billions)
Property & Casualty

Life & Health

Net income (USD millions)
Property & Casualty

Life & Health

Return on equity
Property & Casualty
3.7%
(2017 –3.5%)
Life & Health
11.1%
(2017 15.3%)
Return on equity*
Property & Casualty
5.4%
Life & Health
12.1%
Operating performance
Property & Casualty
104.0%
Combined ratio
(2017 111.5%)
Life & Health
9.4%
Net operating margin
(2017 13.1%)
Corporate Solutions
Corporate Solutions provides risk transfer solutions to large and mid-sized corporations around the world. Its innovative, highly customised products and standard insurance covers help to make businesses more resilient, while its industry-leading claims service provides additional peace of mind.
Net premiums earned and fee income (USD billions)

Net income (USD millions)

Return on equity
–19.4%
(2017 –32.2%)
Return on equity*
–18.5%
Operating performance
133.4%
Combined ratio
(2017 133.4%)
Life Capital
Life Capital manages closed and open life and health insurance books. It provides alternative access to the life and health risk pool, helping to generate stable returns and seize attractive new opportunities.
Net premiums earned and fee income (USD billions)

Net income (USD millions)

Return on equity
0.4%
(2017 2.2%)
Return on equity*
0.3%
Operating performance
818m
Gross cash generation
(2017 USD 998m)
Group
(After consolidation)
Net premiums earned and fee income (USD billions)

Net income (USD millions)

Return on equity
1.4%
(2017 1.0%)
Return on equity*
2.9%
Operating performance
2.9%
Net operating margin
(2017 2.8)
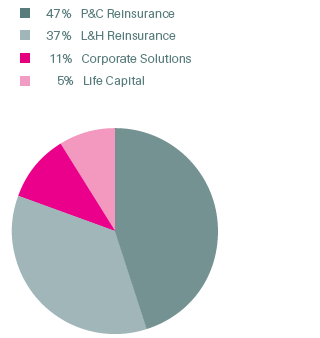
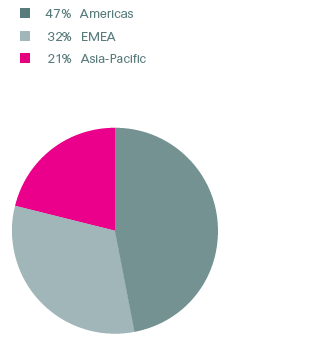
Diversified and global
Net premiums earned and fee income by business segments
(Total USD 34.5 billion)
Net premiums earned and fee income by region
(Total USD 34.5 billion)
* For reference only, excludes the impact of the new US Generally Accepted Accounting Principles (GAAP) guidance on recognition and measurement of financial instruments, which was effective for the Group as of 1 January 2018 and was not retroactively applied.