Business Units at a glance
Working across diversified insurance risks and businesses to maximise shareholder value.
Reinsurance
Reinsurance provides clients and brokers with reinsurance products, insurance-based capital market instruments and risk management services. Reinsurance operates globally through two segments – Property & Casualty and Life & Health.
Net premiums earned and fee income (USD billions)
Property & Casualty

Life & Health

Net income/loss (USD millions)
Property & Casualty

Life & Health

Operating performance
Property & Casualty
111.5%
(93.5% 2016)
Combined ratio
Life & Health
13.1%
(10.4% 2016)
Net operating margin
Return on equity
Property & Casualty
–3.5%
(Over-the-cycle target: 10%–15%)
Life & Health
15.3%
(Over-the-cycle target: 10%–12%)
Corporate Solutions
Corporate Solutions provides risk transfer solutions to large and mid-sized corporations around the world. Its innovative, highly customised products and standard insurance covers help to make businesses more resilient, while its industry-leading claims service provides additional peace of mind.
Net premiums earned and fee income (USD billions)

Net income/loss (USD millions)

Operating performance
133.4%
(101.1% 2016)
Combined ratio
Return on equity
–32.2%
(Over-the-cycle target: 10%–15%)
Life Capital
Life Capital manages closed and open life and health insurance books. It provides alternative access to the life and health risk pool, helping to generate stable returns and seize attractive new opportunities.
Net premiums earned and fee income (USD billions)

Net income/loss (USD millions)

Operating performance
998m
(USD 721m 2016)
Gross cash generation
Return on equity
2.2%
(Mid-term target: 6%–8%)
Total
(After consolidation)
Net premiums earned and fee income (USD billions)

Net income/loss (USD millions)

Operating performance
1.0%
(10.6% 2016)
Return on equity
Return on equity
+700 bps
Over-the-cycle ROE target of at least 700 bps greater than Swiss Re’s designated risk-free rate, currently 10-yr US government bonds.
Diversified and global
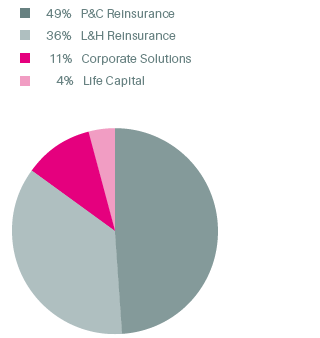
Net premiums earned and fee income by business segments
(Total USD 33.7 billion)
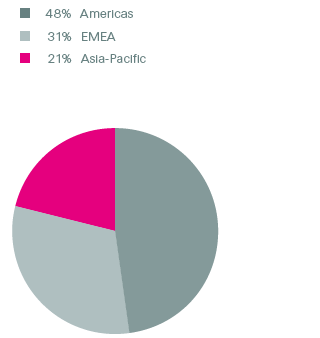
Net premiums earned and fee income by region
(Total USD 33.7 billion)