The global economy and financial markets
Swiss Re delivered a Group net income of USD 3.6 billion, supported by a continued solid underwriting performance and a strong investment result.
Global growth remained moderate in 2016. Stock market performance varied across geographies while benchmark government bond yields reached new lows before recovering towards year-end.
Global economic growth remained moderate in 2016 in an environment of elevated political uncertainty. Stock markets had a negative start to the year before recovering in February. Monetary policy remained expansionary, and benchmark government bond yields reached new lows before recovering towards the end of the year.
Global economy
The US economy barely grew in the first half of 2016 but recovered in the third quarter as the dual headwinds of the impact of low oil prices on energy investments and of the strong dollar on exports abated. The Eurozone continued to grow at a moderate pace, supported by a weak euro. Germany and Spain were among the stronger performers, while growth in France and Italy remained lacklustre. Growth in the UK remained robust even in the aftermath of the Brexit referendum result in June, defying expectations of a slowdown. The Japanese economy continued to muddle along.
Inflation moved up gradually from low levels in most markets, driven by the rebound in the price of oil from a low of USD 26/bbl in February to USD 54/bbl by year-end. Underlying inflation (excluding energy prices) was relatively stable in 2016 at a level consistent with the US Federal Reserve’s (Fed) target in the US, but below target in the Eurozone, the UK and Japan. The election of Donald Trump as president in the US raised expectations of higher inflation in anticipation of increased fiscal spending.
Economic performance in emerging markets also varied. Growth in emerging markets in Asia remained fairly steady and strong, supported by continued strong expansion in China. However, the Chinese economy has become increasingly reliant on government support and is prone to downside risks. India has outperformed since the start of the Modi administration, helped by improved business and consumer sentiment. Growth trends in Sub-Saharan African countries have been diverging. Non-commodity intensive markets, such as Kenya and Ivory Coast, continued to deliver solid growth. In contrast, commodity intensive markets expanded only slowly, or were even in recession due to low commodity prices and insufficient policy adjustments (eg, Nigeria and Angola). The South African economy avoided a recession in 2016, but many local and global headwinds remain.
Economic activity in the Middle East and North Africa was subdued in 2016. Growth in oil-importing countries was modest, and low oil prices took a toll on oil-exporting countries. Business sentiment in the region suffered from a deteriorating security situation and political uncertainty. Latin America’s real GDP contracted for a second year in a row in 2016, dragged down by recessions in Brazil and Venezuela, a growth correction in Argentina, and sluggish growth across the rest of the region. Economic growth in Central and Eastern Europe (CEE) improved from the previous year as economic contraction in Russia moderated and CEE EU-member countries continued to grow albeit at a slower pace.
2.4%
US 10-year Treasury bond yield
Year-end 2016
0.2%
German 10-year Bund yield
Year-end 2016
Interest rates
Monetary policy in the major advanced markets remained accommodative in 2016. Given worries about China, Brexit and weak capital investments in the energy sector, the Fed delayed hiking US interest rates until December, when it increased its policy rate by 25 basis points. In contrast, the European Central Bank (ECB) lowered interest rates further into negative territory and expanded its asset purchase programme. The Bank of Japan (BoJ) continued its asset purchases and shifted its policy focus towards keeping 10-year government bond yields close to 0%. The Bank of England reacted to the political uncertainty resulting from the Brexit vote by cutting rates to 0.25%. Some emerging market central banks, including those of Brazil, Russia and India, also lowered interest rates during 2016.
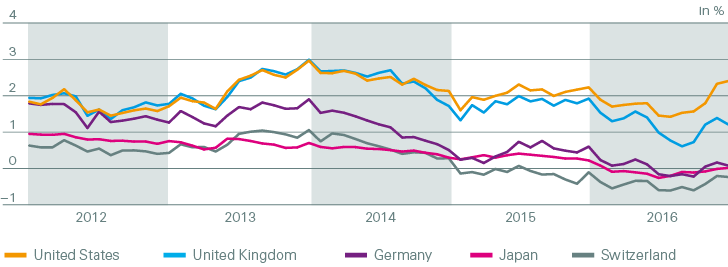
Increased risk aversion during the first half of the year led to a further decline in benchmark government bond yields (see interest rates chart). The yield on the German 10-year government bond dropped into negative territory and yields in many other markets reached new lows, too, after the Brexit vote. Yields recovered towards the end of the year, supported by the election of Donald Trump which fostered expectations of higher growth, inflation and fiscal deficits in the United States. The US 10-year yield ended the year at 2.4%, roughly unchanged from a year earlier. Other yields were mostly lower at the end of 2016. The German yield was 0.2% (down from 0.6% at end 2015), the UK yield 1.2% (vs 2.0%) and the Japanese yield 0.0% (vs 0.3%).
Interest rates for ten-year government bonds 2012–2016

Source: Datastream
Stock market performance
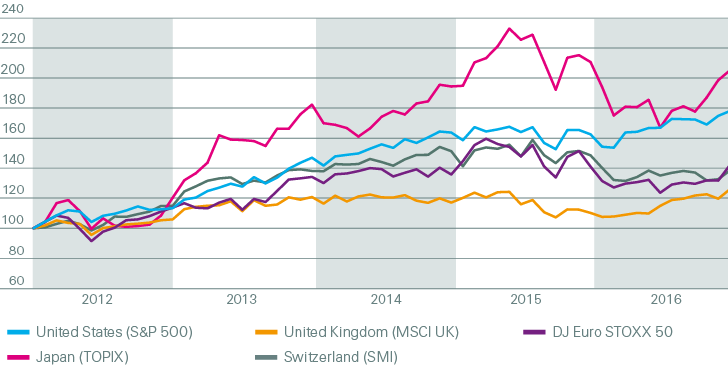
Market jitters in China, declining oil prices and worries about the stability of European banks caused a sharp decline in equity markets at the beginning of the year. As of February, equity markets started recovering along with rising oil prices and stabilising growth in China, supported by continued expansionary monetary policy. The Brexit vote caused only a temporary dip in stock markets and there was a positive market reaction to the election of Trump. Overall equity performance varied across markets with the US S&P 500 (+10%), the MSCI UK (+14%) and the Eurostoxx50 (+1%) ending the year in positive territory, while the Swiss Market Index (–7%) and the Japanese TOPIX (–3%) had negative performance (see stock markets chart).
Stock markets 2012–2016

Source: Datastream
Currency movements
The UK’s vote to exit the European Union was the key driver behind the British pound’s weakening. It ended the year 16% lower against the US dollar. Despite the BoJ’s monetary expansion the Japanese yen strengthened during the first half of the year, ending the year up 3% against the US dollar. The euro (–3%) and the Swiss franc (–2%) ended the year slightly weaker against the US dollar.
Economic and political risks affecting re/insurers
The balance of risks to the economic outlook is tilted to the downside. Growth in China remains heavily dependent on government stimulus and credit expansion. Also, some emerging markets are viewed as vulnerable to rising interest rates in the US, with policy tightening leading to capital outflow. In Europe, the banking sector remains a source of vulnerability as profitability and capitalisation remain low. Other downside risks are mainly political in nature. For example, Brexit and the rising popularity of euro-sceptic parties increase the risk of further destabilisation in the EU, which could result in financial market volatility. In addition, the escalation of regional conflicts (Russia/Ukraine, South China Sea, etc) could also result in financial market volatility.
These risks would affect re/insurers mainly via adverse asset price movements and slower growth potential in affected markets. In addition, a “flight to quality” could lead to a drop in interest rates and exacerbate the challenges from the persistent low yield environment.
Upside risks are more limited and could result from a more-robust-than-expected upswing in the US as the drag from low oil prices and the strong US dollar fades. In Europe, a pick-up in structural reform momentum could boost sentiment and growth. In addition, increased government spending, particularly in the US, could lead to stronger growth. A more rapid upswing in commodity prices could bolster emerging market growth substantially, but would dampen growth elsewhere.
Economic indicators 2015–2016
| Download |
|
USA |
Eurozone |
UK |
Japan |
China |
|||||||||||||
|
2015 |
2016 |
2015 |
2016 |
2015 |
2016 |
2015 |
2016 |
2015 |
2016 |
||||||||
|
||||||||||||||||||
Real GDP growth1 |
2.6 |
1.6 |
1.9 |
1.7 |
2.2 |
2.0 |
1.3 |
1.0 |
6.9 |
6.7 |
||||||||
Inflation1 |
0.1 |
1.3 |
0.0 |
0.2 |
0.0 |
0.7 |
0.8 |
–0.1 |
1.4 |
2.0 |
||||||||
Long-term interest rate2 |
2.3 |
2.4 |
0.6 |
0.2 |
2.0 |
1.2 |
0.3 |
0.0 |
2.8 |
3.0 |
||||||||
USD exchange rate2,3 |
– |
– |
109 |
105 |
147 |
124 |
0.83 |
0.85 |
15.4 |
14.4 |
||||||||