Property & Casualty
Performance
Net income increased 172.1% to USD 3.0 billion in 2012 from USD 1.1 billion in 2011 driven by strong underwriting performance, reflected in significant premium growth and continued very strong underlying margins. Both years benefited from favourable prior accident years development.
Natural catastrophe experience for 2012 was within expectations, while 2011 was heavily impacted by the large Asian natural catastrophe events.
Major natural catastrophe losses in 2012 were caused by Hurricane Sandy, earthquakes in Northern Italy, droughts in the US, Typhoon Bolaven in South Korea and hailstorms in Alberta, Canada.
Property & Casualty results
| Download |
|
USD millions |
2011 |
2012 |
Change in % |
|
Premiums earned |
10 135 |
12 329 |
22 |
|
|
|
|
|
|
Expenses |
|
|
|
|
Claims and claim adjustment expenses |
–7 381 |
–6 306 |
–15 |
|
Acquisition costs |
–1 848 |
–2 316 |
25 |
|
Other expenses |
–1 318 |
–1 325 |
1 |
|
Total expenses before interest expenses |
–10 547 |
–9 947 |
–6 |
|
|
|
|
|
|
Underwriting result |
–412 |
2 382 |
- |
|
|
|
|
|
|
Net investment income |
1 307 |
1 451 |
11 |
|
Net realised investment gains/losses |
512 |
259 |
–49 |
|
Other revenues |
72 |
95 |
32 |
|
Interest expenses |
–155 |
–111 |
–28 |
|
Income before income tax expenses |
1 324 |
4 076 |
208 |
|
Income tax expense |
–65 |
–934 |
- |
|
Income attributable to non-controlling interests |
–160 |
–134 |
–16 |
|
Interest on contingent capital instruments |
|
–18 |
- |
|
Net income attributable to common shareholders |
1 099 |
2 990 |
172 |
|
|
|
|
|
|
Claims ratio in % |
72.8 |
51.2 |
|
|
Expense ratio in % |
31.2 |
29.5 |
|
|
Combined ratio in % |
104.0 |
80.7 |
|
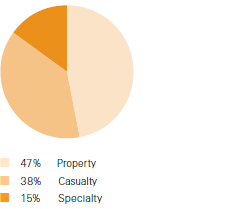
Net premiums earned
Premiums earned by line of business, 2012
(Total USD 12.3 billion)

Net premiums earned increased 21.6% to USD 12.3 billion in 2012, compared to USD 10.1 billion in 2011. Growth was driven by large capital relief quota shares, successful renewals in 2012 following the extraordinary natural catastrophe experience of 2011, and continued premium earnings from large transactions written in 2011. As a consequence, the composition of gross premiums earned by region changed so that Asia and EMEA had higher shares in 2012 than in 2011.
The mix between proportional and non-proportional reinsurance changed only slightly in 2012. Based on gross written premiums (before intragroup retrocession), the share of proportional business increased to 61% in 2012, compared to 59% in 2011, mainly as a result of a large capital relief transaction written in 2012.
Combined ratio
The 2012 combined ratio improved to 80.7%, compared to 104.0% in 2011.
The net impact from natural catastrophes on the 2012 combined ratio was 1.3 percentage points below the expected level of 9.4 percentage points. In 2011, natural catastrophe experience was about 24 percentage points higher than expected.
Both periods benefited from better than expected development of prior accident years, amounting to an 8.1 percentage point improvement for the 2012 combined ratio, compared to about 11 percentage points in 2011.
Lines of business
The property combined ratio improved to 74.2% in 2012, compared to 120.2% in 2011, driven by the more benign natural catastrophe loss experience.
The casualty combined ratio for 2012 was 94.0%, compared to 102.7% in 2011. The improvement was mainly due to more positive prior accident year development in 2012 compared to 2011.
The specialty combined ratio improved slightly to 68.0% in 2012, compared to 68.8% in 2011, reflecting favourable claims experience in prior years across all lines.
Expense ratio
The administrative expense ratio improved to 10.7% in 2012, compared to 13.0% in 2011, mainly driven by the increased premium volume.
Investment result
Return on investment increased slightly to 3.2% in 2012, compared to 3.1% in 2011.
Investment income increased by USD 144 million year on year as lower yields were more than offset by favourable mark-to-market valuations on private equity investments and lower expenses.
Net realised gains decreased USD 253 million to USD 259 million in 2012 largely due to unfavourable foreign exchange movements year over year, partly offset by higher realised gains from government bond sales.
Return on equity
The return on equity for 2012 was 26.7%, compared to 11.0% in 2011. The improvement was mainly due to the lower impact from natural catastrophes.
Outlook
If natural catastrophe risks continue to grow faster than GDP, as we expect, our property business will continue to grow. In the Special Lines business, volume and profit are expected to increase at a marginally higher rate than GDP, with a disproportionately large contribution from high growth markets in Asia and Latin America.
Profit margins in casualty reinsurance are expected to increase modestly from the current low base. We expect to deploy more capital to this segment when this occurs. New solvency regimes will continue to drive demand for capital relief solutions and we are well positioned to support those clients. Starting in January 2013, we will also see an increase in retained premiums due to the expiry of a 20% quota share treaty with Berkshire Hathaway.
