Life & Health
Performance
Net income decreased to USD 739 million in 2012 from USD 1.7 billion in 2011. The decrease was primarily the result of lower investment income driven by significantly lower realised gains on investments and lower yields, a continuation of the negative performance of business written in the US prior to 2004, tax benefits realised in 2011 not repeated in 2012 and higher administrative expenses.
Life & Health results
| Download |
|
USD millions |
2011 |
2012 |
Change in % | ||
| |||||
|
Revenues |
|
|
| ||
|
Premiums earned |
8 317 |
9 050 |
9 | ||
|
Fee income from policyholders |
87 |
72 |
–17 | ||
|
Net investment income – non-participating |
1 544 |
1 365 |
–12 | ||
|
Net realised investment gains/losses – non-participating |
1 180 |
562 |
–52 | ||
|
Net investment result – unit-linked and with-profit |
–25 |
222 |
– | ||
|
Other revenues |
|
1 |
– | ||
|
Total revenues |
11 103 |
11 272 |
2 | ||
|
|
|
|
| ||
|
Expenses |
|
|
| ||
|
Life and health benefits |
–6 280 |
–6 787 |
8 | ||
|
Return credited to policyholders |
–34 |
–271 |
697 | ||
|
Acquisition costs |
–1 745 |
–1 787 |
2 | ||
|
Other expenses |
–1 295 |
–1 419 |
10 | ||
|
Total expenses |
–9 354 |
–10 264 |
10 | ||
|
|
|
|
| ||
|
Income before income tax expenses |
1 749 |
1 008 |
–42 | ||
|
Income tax expense |
–85 |
–231 |
172 | ||
|
Interest on contingent capital instruments |
|
–38 |
– | ||
|
Net income attributable to common shareholders |
1 664 |
739 |
–56 | ||
|
|
|
|
| ||
|
Management expense ratio in % |
7.2 |
7.9 |
| ||
|
Benefit ratio1 in % |
74.5 |
75.5 |
| ||
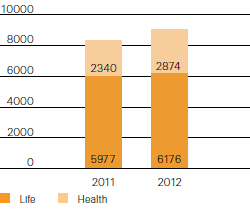
Net premiums earned
Premiums earned by L & H segment, 2011–2012
(USD millions)

Premiums earned and fee income increased 9% to USD 9.1 billion in 2012, compared to USD 8.4 billion in 2011. The increase was primarily a result of increased health premiums due to business growth in Europe and Asia, new longevity transactions, and higher rates related to the Americas business.
Benefit ratio
The benefit ratio increased slightly to 75.5% in 2012, compared to 74.5% in 2011, mainly due to higher claims and continued lapses from the pre-2004 US business.
Expense ratio
The management expense ratio increased to 7.9% in 2012 from 7.2% in 2011. The increase was primarily due to higher costs related to strategic initiatives and an increase in central expenses being charged to the business segment.
Lines of business
A diversified geographical business mix and a continued disciplined pricing approach provided for a stable result; however, volatile financial markets and changes in the interest rate environment impacted the Life and Health results.
Operating income for traditional life business decreased to USD 415 million in 2012 from USD 543 million in the previous year. The decrease was driven primarily by lower investment income, unfavourable experience from pre-2004 US business, and unfavourable variable annuities results, partly offset by favourable mortality experience and favourable market movements relating to the embedded B36 derivatives.
Operating income for the traditional health business decreased to USD 470 million in 2012, compared to USD 633 million in 2011. The decrease was driven by lower investment income, unfavourable morbidity experience, and higher administrative expenses, partly offset by positive recapture experience.
Investment result
The return on investments was 4.7% in 2012, compared to 6.8% in 2011. Realised investment gains were USD 709 million in 2012, compared to USD 1.2 billion in 2011. The decrease was primarily due to less favourable foreign exchange movements in the current year. Net investment income was USD 1.4 billion in 2012, compared to USD 1.5 billion in 2011. The decrease is primarily due to lower yields.
Return on equity
The return on equity was 8.9% in 2012, compared to 21.2% in 2011. The very high return on equity in the prior year was primarily due to exceptionally high realised gains on government bonds and foreign exchange.
Outlook
Life and health primary markets are expected to continue to face the dual challenges of weak economic growth and very low interest rates that limit the attractiveness of some products. In addition, clients may seek to retain more mortality risk. Flow business will therefore continue to be under pressure; however, there are opportunities for large transactions to support clients, such as those with solvency issues or those undertaking mergers and acquisitions. In the medium term we aim to generate an increased contribution from high growth markets, particularly in health. We will also continue to diversify into longevity risk.
We see strong longer-term growth prospects for life and health protection markets and we estimate that there is a protection gap of approximately USD 80 trillion worldwide. We will continue to work with clients and distributors to develop consumer-friendly products and processes (eg, using our in-house predictive underwriting analytics) to address this gap.
