The global economy and financial markets
Global growth remained moderate in 2012, restrained by the ongoing recession in many European economies, while the eurozone debt crisis dominated financial market developments. Benchmark government bond yields rose during the first quarter, but dropped subsequently as the eurozone debt crisis intensified. After the peak of the debt crisis in July, equity markets rallied and bond yields increased slightly. Credit spreads narrowed for most of the year as investors sought higher yields.
1.3%
German 10-year government bond yield end 2012
(2011: 1.8%)
Global economy
The recession in many European economies continued or even intensified in 2012. Tight fiscal policies, restrictive credit conditions and high uncertainty weighed on economic activity, particularly in Europe’s periphery, where fears of a euro exit or break-up also led to capital flight. Moderate growth continued in Germany, supported by extremely low interest rates and robust exports to emerging markets. In the UK, the economy contracted further before growth resumed in the second half of the year. Growth was more robust in the US, but remained fairly moderate despite support in the second half from a recovery in the housing market. Uncertainty regarding the “fiscal cliff” weighed on sentiment and likely affected hiring and investment. Reconstruction spending from the 2011 earthquake and tsunami continued to support the Japanese economy during the first half of the year, but weak global demand hampered economic activity in the second half. Growth in emerging markets remained relatively robust, although it was burdened by sluggish demand in Europe and the US and a slowdown in China due to a tightening of credit conditions (see economic indicators table below).
Consumer price inflation declined during the first half of the year, mainly because oil prices stabilised. By year-end, inflation was close to central banks’ target rates both in the eurozone and the US. Inflation moderated in most emerging markets, with the main exception of India.
Interest rates
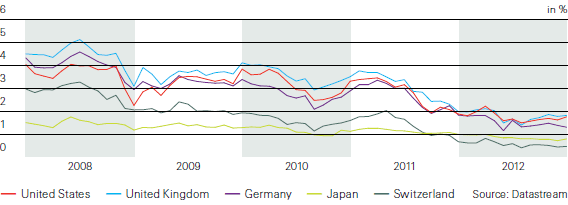
Extremely loose monetary policies continued in 2012. The US Federal Reserve (the Fed) and the Bank of England kept interest rates close to zero, while the European Central Bank (ECB) lowered rates to 0.75% in July. The Bank of England also increased the size of its government bond purchase programme, while the Fed increased its purchases of longer-dated government bonds at the expense of shorter securities (“Operation Twist”). In September, the Fed also started to purchase mortgage-backed securities to support mortgage markets. Yields on US, UK, and German government bonds increased slightly during the first few months of the year, but then fell sharply as increased risk aversion and central banks’ commitment to maintain low interest rates boosted demand for relatively creditworthy government bonds. During the second half of the year, bond yields rose slightly with improving market sentiment, but ended the year well below their January levels (see interest rates chart).
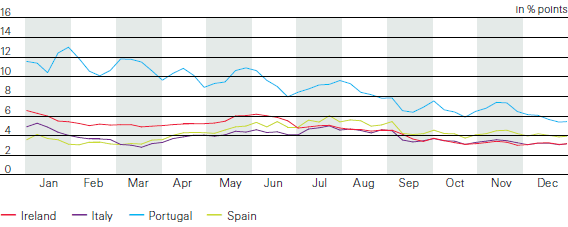
The spreads of Spanish, Irish and Italian sovereign bond yields initially narrowed against the German benchmark, then widened sharply on increased euro exit or break-up fears, to narrow again in the second half of the year (see bond spread chart). Yield spreads between investment grade corporate bonds and government bonds followed a similar pattern, narrowing significantly over the course of the year.

Stock market performance
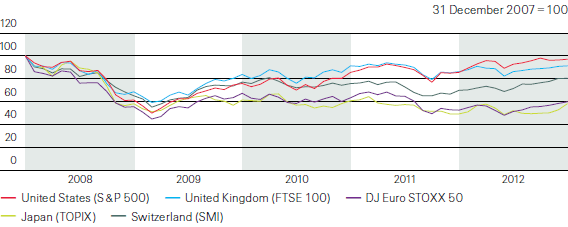
The eurozone debt crisis continued to drive stock market performance in 2012. Early in the year, stock markets profited from several positive developments: the March agreement on the second Greek bailout averted any imminent risk of a disorderly Greek sovereign default and euro exit or break-up. The accompanying debt restructuring left private investors less exposed to Greece, mitigating contagion risk from potential future Greek defaults. The ECB’s unlimited liquidity provision to European banks also averted the risk of a liquidity-driven bank failure. This, plus increasing evidence that the US economy would avoid recession, helped boost stock market performance (see stock markets chart).
Risk appetite diminished in the second quarter as European economic indicators deteriorated and elections in Greece favoured radical parties that opposed the adjustment programme that had been agreed with the EU, the IMF and the ECB. This aggravated fears of a Greek exit from the euro, leading to widespread contagion and capital flight from Europe’s peripheral economies. Only the ECB’s forceful commitment at the end of July to do “whatever it takes” to preserve the single currency managed to contain the turmoil. Political agreement on increased fiscal and banking sector integration and the ECB’s commitment to act as governments’ “lender of last resort” restored market confidence. The major stock markets showed positive 2012 performance ranging from 6% (FTSE 100) to 18% (TOPIX).
Currency movements
2.2%
US real GDP growth 2012
(2011: 1.8%)
During the first few months of the year, the US dollar weakened slightly against the euro, the British pound, and the Swiss franc, before strengthening significantly as the escalating debt crisis weighed on these currencies (see currency section of economic indicators table). Towards year-end, the US dollar weakened again reflecting rising market confidence to end the year slightly weaker versus the euro (–2%), the Swiss franc (–3%) and the British pound (–5%). On the other hand the dollar gained 11% against the Japanese yen on expectations of significant monetary easing by the Bank of Japan.
Economic indicators 2011 – 2012
| Download |
|
|
USA |
Eurozone |
UK |
Japan |
China | |||||||||||
|
|
2011 |
2012 |
2011 |
2012 |
2011 |
2012 |
2011 |
2012 |
2011 |
2012 | ||||||
| ||||||||||||||||
|
Real GDP growth1 |
1.8 |
2.2 |
1.5 |
–0.5 |
0.9 |
0.2 |
–0.5 |
1.9 |
9.3 |
7.8 | ||||||
|
Inflation1 |
3.1 |
2.1 |
2.7 |
2.5 |
4.5 |
2.8 |
–0.3 |
0.0 |
5.4 |
2.7 | ||||||
|
Long-term interest rate2 |
1.9 |
1.8 |
1.8 |
1.3 |
2.0 |
1.8 |
1.0 |
0.8 |
3.5 |
3.6 | ||||||
|
|
|
|
|
|
|
|
|
|
|
| ||||||
|
Per 100 units of foreign currency, as of 31.12.2012 | ||||||||||||||||
|
USD |
- |
- |
130 |
132 |
155 |
162 |
1.30 |
1.15 |
15.9 |
16.0 | ||||||
|
CHF |
93.9 |
91.5 |
122 |
121 |
146 |
149 |
1.22 |
1.06 |
14.9 |
14.7 | ||||||


