Compensation context and highlights in 2016
Pay for performance
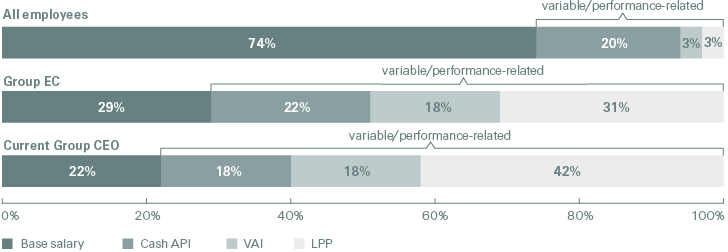
The Compensation Committee ensures that executive management compensation is linked to the business performance of Swiss Re by delivering a substantial portion of compensation in the form of variable and performance-related incentives.
| Download |
|
|
Fixed |
Variable/ |
of which deferred |
|
All employees |
74% |
26% |
22% |
|
Group EC1 |
29% |
71% |
70% |
|
Current Group CEO |
22% |
78% |
76% |

The Compensation Committee monitors how compensation is aligned with specific business metrics, including US GAAP net income and EVM profit.
| Download |
|
USD millions (unless otherwise stated) |
2014 |
2015 |
change |
2016 |
change |
||||||||
|
|||||||||||||
|
US GAAP net income |
3 500 |
4 597 |
31% |
3 558 |
–23% |
||||||||
|
EVM profit |
1 336 |
480 |
–64% |
1 399 |
191% |
||||||||
|
Regular dividend payments (CHF)1 |
4.25 |
4.60 |
8% |
4.85 |
5% |
||||||||
|
Financial Strength Rating (Standard & Poor’s) |
AA- |
AA- |
|
AA- |
|
||||||||
|
Total equity |
36 041 |
33 606 |
–7% |
35 716 |
6% |
||||||||
|
Regular staff worldwide |
12 224 |
12 767 |
|
14 053 |
|
||||||||
|
Aggregate compensation for all employees (CHFm)2 |
2 081 |
2 213 |
6% |
2 265 |
2% |
||||||||
|
Group EC members3,4 |
13 |
12 |
|
14 |
|
||||||||
|
Aggregate Group EC compensation (CHF thousands)2 |
42 612 |
47 360 |
11% |
51 430 |
9% |
||||||||
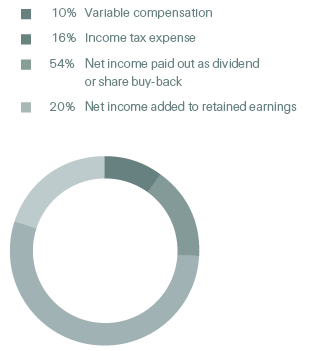
Attribution of Group income to key stakeholders
| Download |
|
USD millions (unless otherwise stated) |
2014 |
% |
2015 |
% |
2016 |
% |
||||
|
||||||||||
|
Income before tax and variable compensation |
4 629 |
100% |
5 758 |
100% |
4 773 |
100% |
||||
|
Variable compensation |
471 |
10% |
510 |
9% |
466 |
10% |
||||
|
Income tax expense |
658 |
14% |
651 |
11% |
749 |
16% |
||||
|
US GAAP net income attributable to shareholders |
3 500 |
|
4 597 |
|
3 558 |
|
||||
|
of which paid out as dividend1 |
2 608 |
57% |
1 561 |
27% |
1 572 |
33% |
||||
|
of which share buy-back |
|
|
1 018 |
18% |
1 0172 |
21% |
||||
|
of which added to retained earnings within shareholders’ equity |
892 |
19% |
2 018 |
35% |
969 |
20% |
||||
Attribution of 2016 Group income (in USD millions)

Performance and compensation
Key considerations for annual compensation decisions cover US GAAP and EVM based business results, qualitative factors and Swiss Re’s pay-for-performance approach.
Swiss Re Group and Business Units
The Group delivered good US GAAP and strong economic results. Net income was supported by all Business Units, with a strong contribution from investments. The Group’s overall underwriting performance was solid, with technical profitability across all businesses. Property & Casualty Reinsurance delivered good US GAAP and solid economic results. Life & Health Reinsurance exceeded its return on equity (ROE) target and reported strong economic results. The Corporate Solutions US GAAP result was driven by continued pricing pressure and large man-made losses, and the economic result was impacted by the non-recognition of intangible assets (including goodwill) related to the IHC acquisition. Life Capital delivered a strong performance across all metrics and generated significant gross cash for the Group.
US GAAP financial performance
Property & Casualty Reinsurance achieved good results in a challenging market environment. Despite various large losses, notably wildfires in Canada, Hurricane Matthew and an earthquake in New Zealand, the business segment delivered a good ROE for the year, supported by favourable prior accident year development and investment results. Life & Health Reinsurance continues to report good US GAAP results, demonstrating sustainability in its performance. Premium growth reflects the realisation of attractive opportunities, in particular through large transactions in the US, successful renewals and new business deals in Asia. The net operating margin of the business segment remains solid, underlining the quality of the in-force book and the profitability of the new business.
The Corporate Solutions result was impacted by continued pricing pressure and large man-made losses, in particular casualty losses in North America. The Business Unit continued to pursue its disciplined growth strategy. In 2016, Corporate Solutions acquired IHC Risk Solutions, LLC (IHC) in the US, opened an office in Kuala Lumpur, obtained an insurance license in Hong Kong, and signed an agreement with Bradesco Seguros, which, once completed, will make Swiss Re a leading commercial large-risk insurer in Brazil. Premiums earned increased slightly compared to 2015, driven by the IHC acquisition.
Life Capital, which includes ReAssure (formerly Admin Re®) and, as of 6 January 2016, the operations formerly known as Guardian Financial Services (Guardian), reported strong results, driven by investment performance, mainly from the Guardian portfolio, and solid underlying business performance. Gross cash generation was strong, driven by management actions and despite the unfavourable impact of decreasing interest rates in the UK.
For further details on the US GAAP financial performance, refer to Group Results of this Financial Report.
Economic Value Management financial performance
The Group’s EVM profit in 2016 reflects a strong investment result and a strong Life & Health Reinsurance new business result. The EVM result of P&C Reinsurance was driven by a favourable previous years’ business result and a new business profit reflecting market softening and large losses. The Life & Health Reinsurance underwriting result was strong, driven by large transactions in the US, health initiatives and business growth in Asia, partially offset by higher capital costs for previous years’ business. Corporate Solutions generated a small EVM new business loss primarily driven by the non-recognition of intangible assets (including goodwill) related to the IHC acquisition, continued pricing pressure and large man-made losses, partially offset by higher profit from investment activities. Life Capital reported a strong EVM profit driven by strong investment results, partially offset by new business expenses and higher capital costs due to the adoption of Solvency II and lower risk-free interest rates. Investment activities generated a strong EVM profit in 2016 mainly driven by the impact of credit spread tightening and performance from equities and alternative investments. The largest EVM profits were in Life Capital and Life & Health Reinsurance, which hold the majority of the Group’s credit investments.
For further details on the economic financial performance, refer to the EVM section of this Financial Report.
Qualitative and overall assessment
Qualitatively, Swiss Re has made noticeable improvements in 2016. Global employee engagement survey scores increased and remain above the relevant external benchmarks. Client centric behaviour also improved and is now close to the relevant externally benchmarked high performance norm. Additionally, Corporate Solutions concluded two important acquisitions (IHC in the US and Bradesco Seguros in Brazil) while Life Capital oversaw a very successful transition of the recent Guardian acquisition.
Both the Compensation Committee and the full Board of Directors assessed the 2016 performance of Swiss Re Group as solid across all metrics. The overall performance in the reported year was lower compared to the very good performance in 2015 but stronger compared to 2014. Consequently, variable compensation pools for the Group EC and other employees were set at lower levels than in 2015.
Value Alignment Incentive
Value Alignment Incentive (VAI) performance is measured for the Group and each underlying business area. The performance factor for each participant is determined based on the business area that the participant was in at the time of award. In March 2016, the Group VAI 2012 (awarded in 2013) vested with a performance factor of 101.5% (see Value Alignment Incentive for a detailed description of the VAI).
The VAI 2012 performance factor of 101.5%, which applies to all Group functions, was driven by slightly positive business developments and good investment performance in 2013, mostly offset by the investment underperformance in 2014 and 2015.
| Download |
|
VAI plan year |
Performance measurement period elapsed |
Swiss Re Group Performance factor |
|
2009 (awarded 2010) |
3 years (closed) |
104.0% |
|
2010 (awarded 2011) |
3 years (closed) |
105.9% |
|
2011 (awarded 2012) |
3 years (closed) |
103.0% |
|
2012 (awarded 2013) |
3 years (closed) |
101.5% |
|
2013 (awarded 2014) |
3 years |
to be determined |
|
2014 (awarded 2015) |
2 years |
to be determined |
|
2015 (awarded 2016) |
1 year |
to be determined |
Leadership Performance Plan
The LPP award is consistently linked to Swiss Re Group’s future achievement of multi-year performance conditions (ROE and relative Total Shareholder Return/TSR), keeping the focus on the long-term success of the Group. Swiss Re made LPP grants in 2016 consistent with this rationale. The LPP is generally part of total target compensation (see Leadership Performance Plan for a detailed description of the LPP).
The LPP 2013 plan was granted on 1 April 2013 and vested on 31 March 2016.
The Restricted Share Unit (RSU) component is measured against an ROE performance condition. At the end of each year, the performance is assessed and one third of the RSUs are locked in within a range of 0% to 100%. At the end of the three-year period, the total number of units locked in vests. For the LPP 2013 the average performance factor for the RSUs was 99.7% for the three-year period.
The Performance Share Unit (PSU) component is based on relative TSR, measured against a pre-defined basket of peers and vests within a range of 0% to 200%. For the LPP 2013 the performance factor for the PSUs was 60% for the three-year period.